
- XRP downside risks persist amid subdued sentiment in the broader cryptocurrency market.
- XRP futures open interest and trading volume decline, while long position liquidations prevail.
- The SuperTrend indicator’s buy signal suggests that selling pressure could be easing, potentially setting the stage for a near-term rebound.
Ripple’s (XRP) bulls are struggling to limit downside risks while the broader cryptocurrency market consolidates. The international money transfer token trades at around $2.18 after extending losses by 4%. Fundamentals from the derivatives market suggest that overhead pressure could continue to overshadow demand, especially with the Open Interest (OI) and trading volume falling sharply.
XRP risks extending losses as open interest and volume drop
The XRP derivatives market exhibits signs of a potentially prolonged downtrend, primarily due to a decline in open interest (OI) and trading volume. According to CoinGlass data, OI declined by almost 3% to $3.91 billion over the past 24 hours. This drop coincides with a larger 14% plunge in trading volume to $3.53 billion, signaling a decline in trader interest in XRP and low market participation.
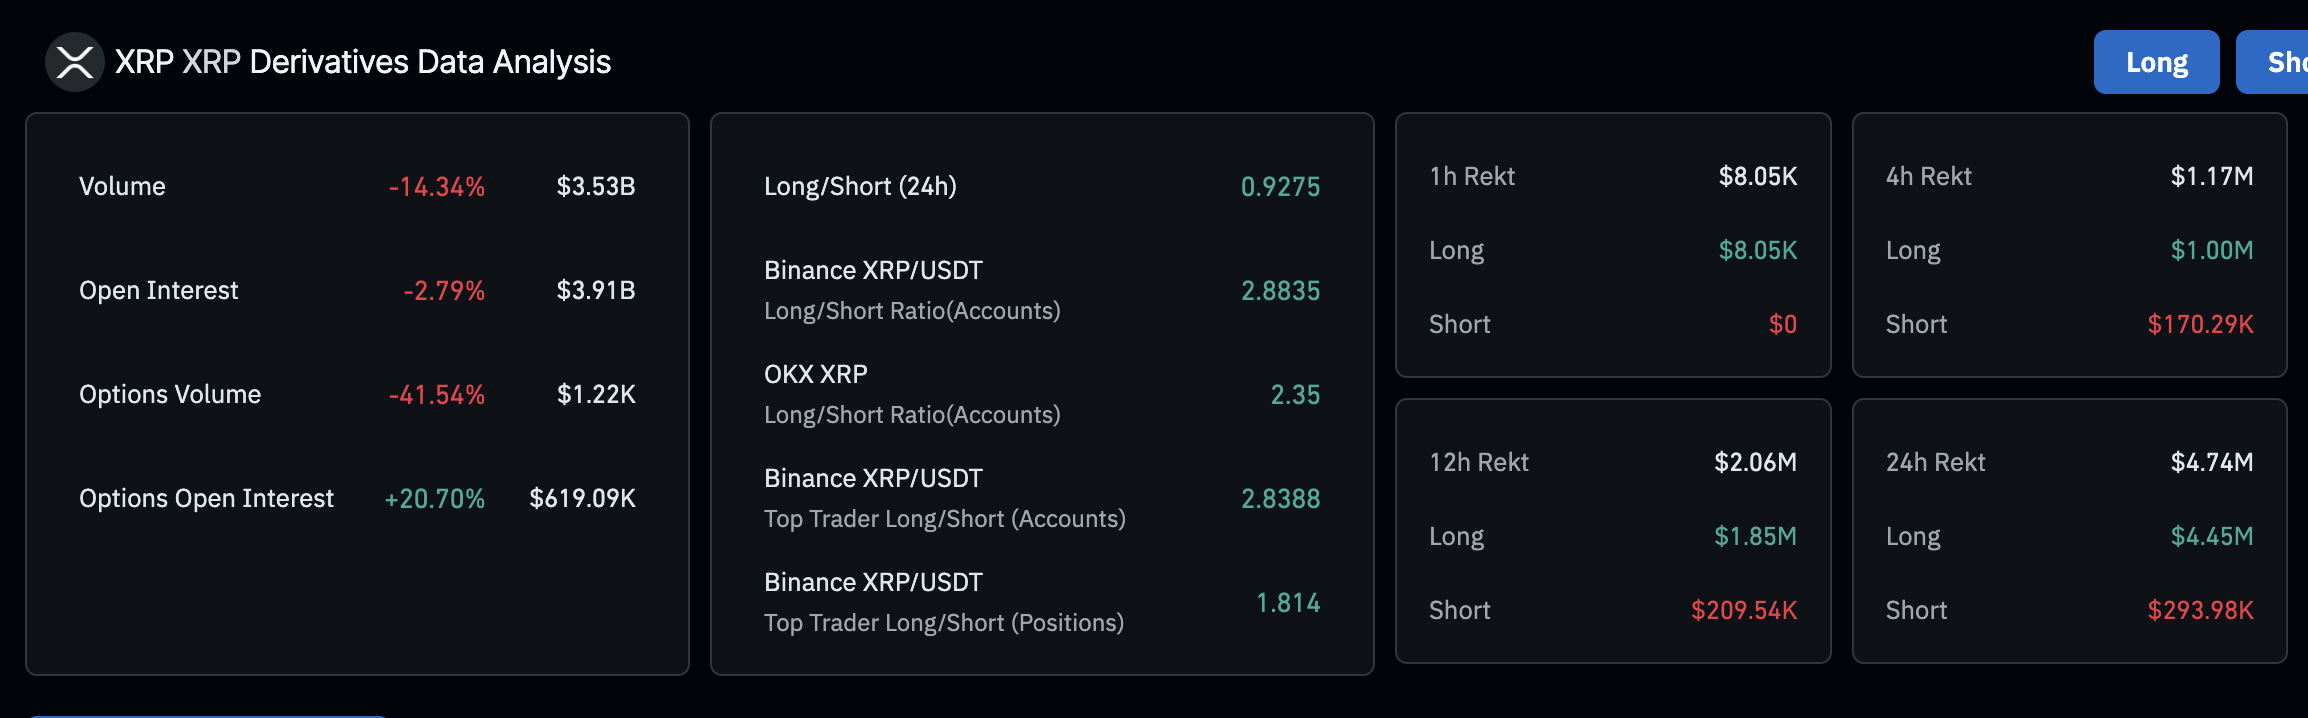
XRP derivatives market data | CoinGlass
The price drop, coupled with the falling OI, could continue to fuel liquidations. Long position traders currently bear the biggest brunt of the changing market dynamics, with $4.45 million in value wiped out, compared to approximately $294,000 in shorts. If XRP upholds the downtrend in upcoming sessions, the long-to-short ratio at 0.9275 could continue to favor sellers, reducing the probability of a trend reversal.
Technical outlook: What’s next as XRP losses surge
XRP hovers under key moving averages such as the 4-hour 200-period Exponential Moving Average (EMA) currently at $2.27, the 100-period EMA at $2.25 and the 50-period EMA at $2.22. This, alongside a sell signal from the Moving Average Convergence Divergence (MACD) indicator, underscores the overhead pressure.
The blue MACD line recently crossed below the red signal line, validating the sell signal and likely encouraging traders to reduce exposure to XRP. Furthermore, the expanding red histogram bars below the mean line (0.00) increase downside risks.
Based on the Money Flow Index (MFI), which tracks the amount of money flowing into and out of XRP, there is a higher probability that declines could extend to test support at $2.07.
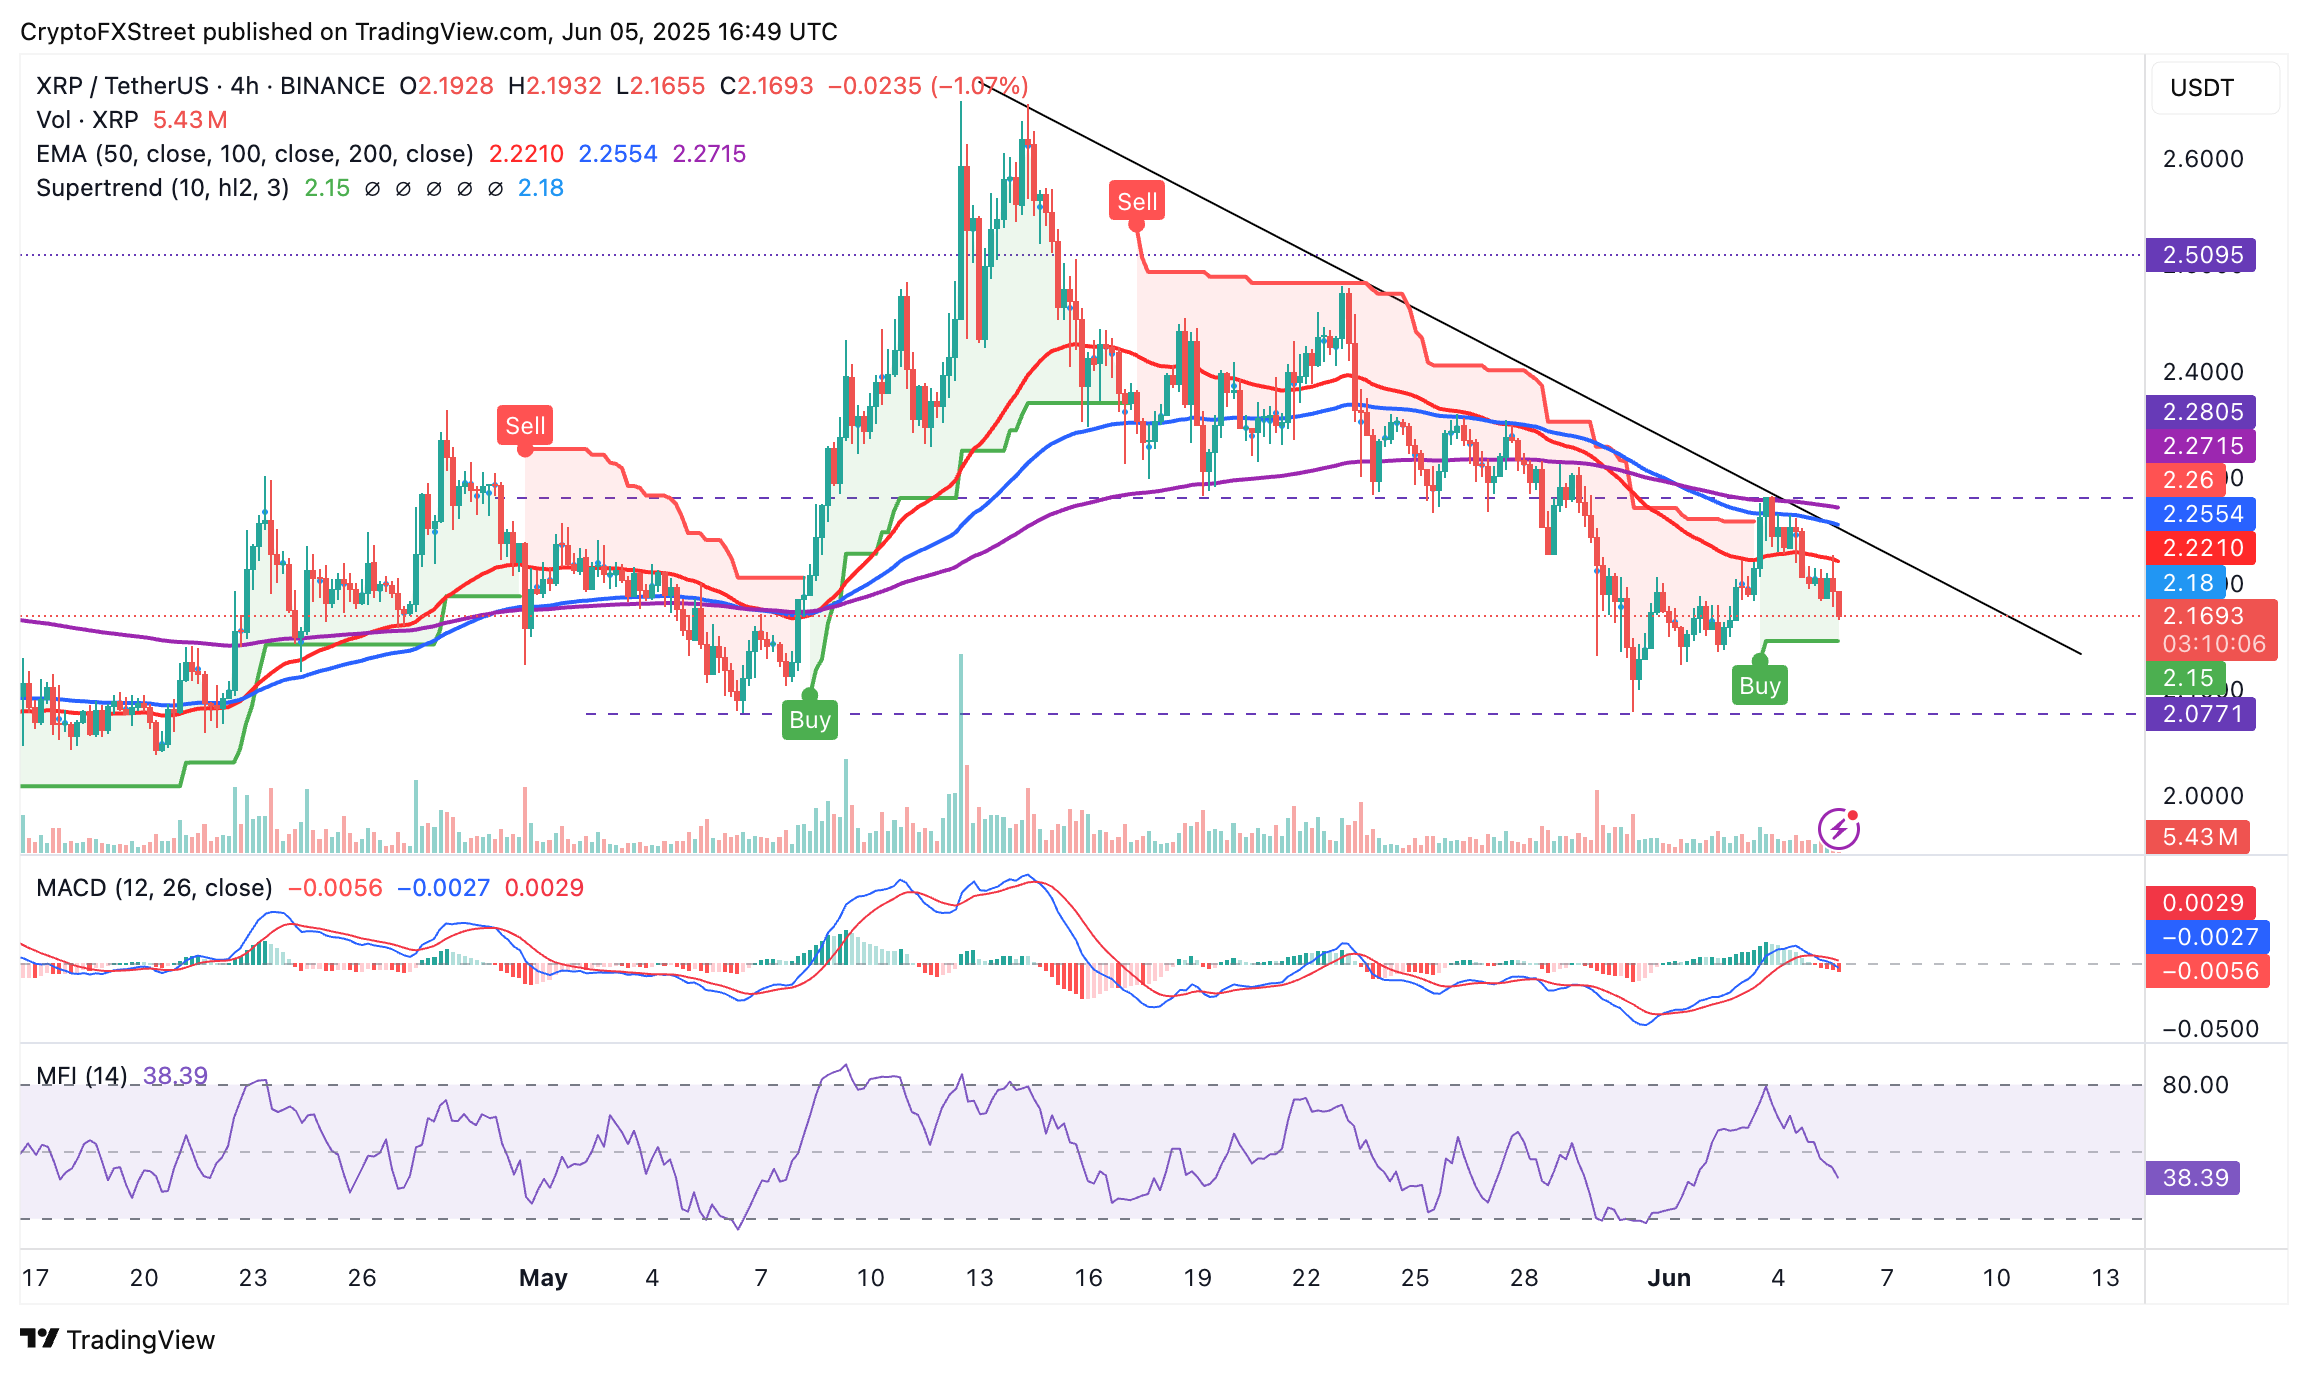
XRP/USDT 4-hour chart
Despite the bearish outlook, the SuperTrend indicator suggests a potential near-term trend reversal after flashing a buy signal in the same 4-hour timeframe. The trend-following tool serves as dynamic support and resistance by utilizing the Average True Range (ATR) to measure market volatility. Traders often consider buying when the price crosses above the SuperTrend line, changing color from red to green.
A reversal cannot be ruled out at the momentum, which means that the 50-period EMA at $2.22, the 100-period EMA at $2.25 and the 200-period EMA at $2.27 are key areas of interest to traders betting on a potential rebound.